Transformation with Missing Values
You may use an Image with NaN as missing values.
import numpy as np
from matplotlib import pyplot as plt
from matplotlib.image import imread
from mpl_toolkits.axes_grid1 import ImageGrid
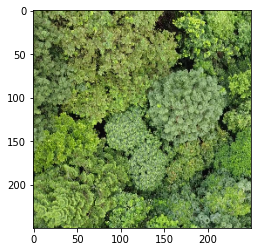
Read Image and cast type
Note that NaN values can only be assigned to float like arrays.
ar = imread("../../../data/image.jpg")[:1000:4, :1000:4]
plt.imshow(ar)
ar = ar.astype(np.float64)
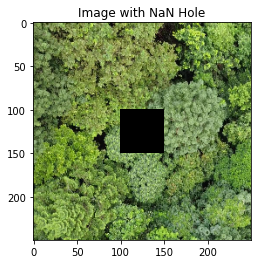
Create artificial hole, missing data
ar[100:-100, 100:-100] = np.nan
plt.imshow(ar / 256)
plt.title("Image with NaN Hole")
plt.show()
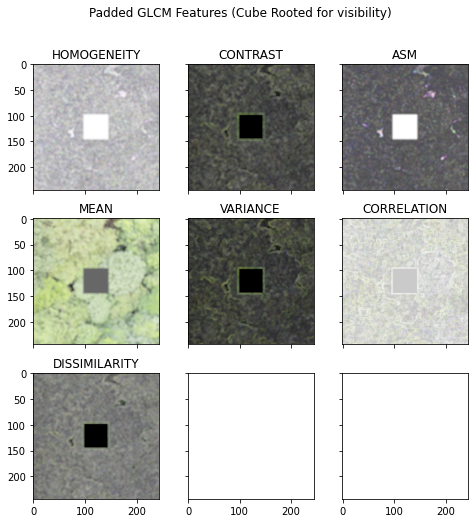
Transform & Plot Transformation
Notice how GLCM works around the hole.
For GLCM Windows that are totally NaNs, the result is a NaN.
For GLCM Windows that partially contain NaNs, the result is the GLCM of the non-NaN values
from glcm_cupy import glcm

radius = 2
step_size = 1
ar_g = glcm(ar, bin_from=256, bin_to=16, radius=radius, step_size=step_size)
# Plot in a grid
fig = plt.figure(figsize=(12, 8))
grid = ImageGrid(fig, 111,
                 nrows_ncols=(3, 3),
                 axes_pad=0.4)

for ax, f_ix, title in zip(grid, range(ar_g.shape[-1]),
                           ("HOMOGENEITY", "CONTRAST", "ASM", "MEAN",
                            "VARIANCE", "CORRELATION", "DISSIMILARITY"), ):
    ax.imshow(ar_g[..., f_ix] ** (1 / 3))
    ax.set_title(title)
fig.suptitle('Padded GLCM Features (Cube Rooted for visibility)')
GLCM Progress: 100%|██████████| 714k/714k [00:02<00:00, 335k Cells/s]
Text(0.5, 0.98, 'Padded GLCM Features (Cube Rooted for visibility)')