Transformation with Padding
To avoid image shrinking, you may opt to pad your array with np.nan or other values.
We will only discuss with np.nan, feel free to adapt to custom padding functions.
We achieve padding with np.pad
from pathlib import Path

import numpy as np
from matplotlib import pyplot as plt
from matplotlib.image import imread
from mpl_toolkits.axes_grid1 import ImageGrid

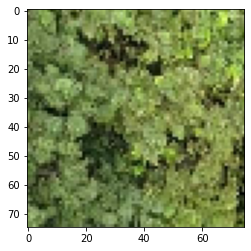
ar = imread("../../../data/image.jpg")[:300:4, :300:4]
plt.imshow(ar)
<matplotlib.image.AxesImage at 0x1ffe596bca0>

Inspection of GLCM Transformation Size
from glcm_cupy import glcm

radius = 3
step_size = 4
g = glcm(ar, bin_from=256, bin_to=16, radius=radius, step_size=step_size)
print(ar.shape, g.shape)
GLCM Progress: 100%|██████████| 44.7k/44.7k [00:00<00:00, 258k Cells/s]
(75, 75, 3) (61, 61, 3, 7)
Notice that the dimensions reduces by 2 * (step_size + radius)
We can counter this by adding np.nan around the edges of the image.
Padding with np.nan
The following is the recipe to pad an image to retain dimension sizes
padding = radius + step_size
ar_pad = np.pad(ar,
                pad_width=((padding,), (padding,), (0,)),
                constant_values=np.nan)
ar_g = glcm(ar_pad, bin_from=256, bin_to=32, radius=radius, step_size=step_size)
print(ar.shape, ar_g.shape)
GLCM Progress: 100%|██████████| 67.5k/67.5k [00:00<00:00, 159k Cells/s]
(75, 75, 3) (75, 75, 3, 7)
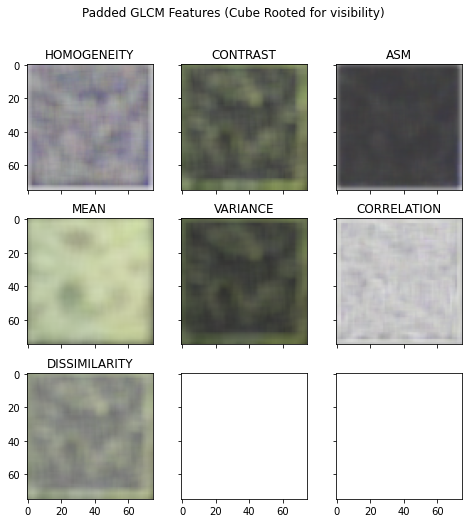
Plot Transformation
Notice the behaviour of the transformation with padding, this can cause unnatural artifacts along the edges.
# Plot in a grid
fig = plt.figure(figsize=(12, 8))
grid = ImageGrid(fig, 111,
                 nrows_ncols=(3, 3),
                 axes_pad=0.4)

for ax, f_ix, title in zip(grid, range(ar_g.shape[-1]),
                           ("HOMOGENEITY", "CONTRAST", "ASM", "MEAN",
                            "VARIANCE", "CORRELATION", "DISSIMILARITY"), ):
    ax.imshow(ar_g[..., f_ix] ** (1 / 3))
    ax.set_title(title)
fig.suptitle('Padded GLCM Features (Cube Rooted for visibility)')
Text(0.5, 0.98, 'Padded GLCM Features (Cube Rooted for visibility)')
